Test reflection Section 4
Posted on: February 9, 2011
I think I did fine overall, but I need to use more economic terms to be more precise in what I am saying. I need to remember to explain about opportunity cost, and fixed/floating/managed exchange rates in details to fully answer the question. Also, I need to revise supply side and demand side policies to include them when I talk about reduce AD.
Thank you for your comments 🙂
Cambodia statistics
Posted on: February 3, 2011
| Cambodia | |
| HDI | 0.494 |
| GDP (PPP) | $11.36 billion |
| GDP/capita | 1,952 |
| Population Growth Rate | 1.705% |
| GINI coefficient | 44.2 |
| Unemployment rate | 3.5% |
| Dependency ratio | 80 per 100 |
| Crude death rate | 8 |
| Crude birth rate | 25 |
Life expectancy at birth: 62.28
 |
|
|
tourism, garments, construction, rice milling, fishing, wood and wood products, rubber, cement, gem mining, textiles
|
|
Explain why a depreciation of a country’s exchange rate may not always lead to an improvement in its current account of the balance of payments.
Posted on: January 19, 2011
- Demands of the question (M08)
- 10 marks (paper 2)
- 20 minutes on it
- Explain how depreciation may lead to an improvement in its current account, and how it may not lead to it
- Definition
- Exchange rate: An exchange rate is the price of one currency expressed in terms of another. An exchange rate system is the way in which the exchange rate is determined (fixed, floating, managed)
- Depreciation: downward movement in a floating exchange rate
- Balance of payments: measure the international trade performance of an economy and show how well it is managing to match imports and exports of goods and services and the flows of investment in and out of the country.
- Current account: records imports and exports of goods (sometimes known as the ‘balance of trade’ or ‘visible trade’) and imports and exports of services (sometimes known as ‘invisible trade’).
- Triple A
- Floating exchange rate: this is an exchange rate which accepts that market forces will determine rates based on how they view a country’s trade performance and its economic and political stability. These systems cost less to maintain but can result in vast swings and changes in currency values. This can seriously affect trade performance and confidence
- Overall the balance of payments accounts will always balance (hence the name), although there may be deficits or surpluses on the various sections within the overall accounts. They must balance as any flows of foreign exchange into and out of the country must ultimately match. If there is a deficit in trade on goods and services, then this must be compensated by an inflow of investment funds
- The balance of trade in goods is often known simply as the ‘balance of trade’ and this represents visible exports minus visible imports. The current account balance is the net balance of all of these items – the net balance of trade in goods and the net balance of trade in services and net income flows
- Bullet points
- PowerPoint slides
- Diagrams

- Evaluation
Consequences of current account deficit (devaluation will reduce those):
•A persistent and large deficit (high percentage of GDP) is perceived as economic weakness.
•Preference for foreign good
•Domestic goods not competitive in price or quality
•High exchange rates makes imports cheap and exports expensive
•No domestic capacity to meet demand
.
Pros and Cons on PowerPoint
Using information from your research and your knowledge of economics evaluate the US claim that China is manipulating its currency.
The US and China are the two greatest power in the world right now. They have been trading, so exchanging goods and services, with each other for a long time now, since China opened up to the world. Chinese products are known to be cheap almost everywhere else in the world; thus Americans consume much of it.
The Chinese export their products; hence they manufacture them in China and then sell them to the world. The US imports them into their country, since they are so affordable. The issue is that, in order to keep a balance in the economies, they need to find a balance in the number of imports and exports. Nevertheless, the US imports a lot more from China than it exports from it; and vice versa for China. As a result, the US is in deficit to China, while China is in deficit to the US.
In order to fully understand the causes and consequences of this, we need to look at currency exchange rates. The US believes in free market, thus it has a floating exchange system, which means that the value of the currency is decided only by the equilibrium point in the supply and demand diagram for the currency, as shown on the diagram below.

This diagram represents the floating system of the US since only the supply curve S and demand D determine the equilibrium point Ep, thus price P. This price P is the price of US dollars in terms of Yuan, in order words how much Yuan bills are needed to buy 1 US dollar. Since the market is floating it is responds highly to change either in demand or supply of dollars, thus fluctuates often.
On the contrary, China has a managed, which means that the value of its currency is set to a certain number of dollars by the government, and does not respond to changes in the market, as shown on the diagram below.

The diagram is a fixed exchange rate because it both managed and fixed, the price of Yuan in terms of Dollars depend on the government, and is set below the equilibrium point Ep for a price of P*. As a result, there is a shortage of Yuan of Q1-Q2.
So, why does this even matter? In order to answer this question fully, we need to first understand the balance of payments, which is a measure of a country’s trade’s performance. It is made of the current (visible and invisible trade, and net transfers) and capital (transfers of capital, investment and loans, and national reserve) account, which need to balance each other out so that the balance of payment is equal to 0.
The US have a balance of payment that is negative, and China has a positive one, and this is an issue for both of them because it creates international tensions, that may, in the long term, deterior the relationship between the two countries.
Hope might be in sight for the UK: The Marshall-Lerner Condition and the J-Curve
Posted on: December 6, 2010
The UK’s currency depreciated, but since the exports and imports are demand inelastic, a change in price will not lead to a great increase in quantity; thus imports are more expensive but the quantity did not change, and exports are cheap but not more people demand it. Therefore, the Marshal Lerner condition was not filled out.
Since the condition was not filled out, the UK did not get better but the currency devaluated, thus it became even worse, so the first part of the J-curve. Nevertheless, as the world noticed that UK exports are cheap they may demand more, and the UK suppliers may be able to be more efficient thus they may meet the need of the people of the country, so the UK economy will get better. The J-curve will then be complete.
Spain’s prison
Posted on: December 6, 2010
Spain was one of the first countries who wanted to join the Euro Area, because it thought having a single currency would help them develop. Nevertheless, recently Spain has been in more trouble than other European countries such as Germany, but the Euro’s exchange rate and policies have to be one for all. Therefore, Spain cannot help its country right now with policies, so it is getting worse and worse. It is stuck in Europe.
If Spain wants to fix its economy, the best way would be for it to get out of Europe and get its own currency back so that it could use policies. Neverthless, it cannot do that easily, so its economy is getting worse, and is not ready to get better soon.
Good Job
I think I understand it quite well because I understand the diagrams and so on. Nevertheless, I get confused sometimes about increase and decrease of GDP. I mix up between aggregate demand and international demand. I need to make sure I remember that when GDP increases, demand for imports also increases.
Overall I think this is not my best topic since I have to think a lot about it to make sure I do not get mixed up.
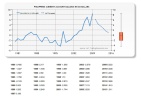
France Balance of Payments
Posted on: November 29, 2010
Historical trends
It has been in deficit since 2004.
Current account deficit 2.67% of GDP
Current account -56.13 billion $
GDP 2.097 trillion $

